Community Science InstituteCommunity Science InstituteCommunity Science InstituteCommunity Science Institute
  • Get Involved
    • Volunteer With Us!
    • Monitoring Partnerships
      • Harmful Algal Bloom Monitoring on Cayuga Lake
      • Synoptic Sampling
      • Biological Monitoring
      • Owego Creek Tributaries Monitoring Project with Trout Unlimited
      • Past CSI Monitoring Programs
        • Red Flag Monitoring
    • Outreach and Education
      • Public Events and Presentations
      • Publications
      • The Water Bulletin Newsletter
      • CSI News and Monthly Updates
      • Journey of Water
      • Learning Materials
  • I want to test my water
    • Potable and Non-Potable Water Tests & Fees
    • Drinking Water Resources for the General Public
  • CSI Water Quality Data
    • Database Home
    • Streams and Lakes Data
      • Cayuga Lake Region
      • Seneca Lake Region
      • Upper Susquehanna River Region
      • Select and Download Streams and Lakes Data
    • HABs Database
      • Select and Download Cayuga Lake HABs Data
    • Pre-Fracking Groundwater Baselines
      • Select and Download Groundwater Baselines
    • Biological Monitoring Results
    • Glossary
  • About Us
    • Meet Our Staff
    • Employment Opportunities
    • Meet Our Board of Directors
    • Annual Reports
    • Frequently Asked Questions
    • Contact Us
  • Donate
    • CSI’s Business Membership Program
    • 2025-2026 Business Membership Partners

Learning Materials

  • The Water Bulletin Newsletter
  • Public Events and Presentations
    • Drinking Water Wednesdays
    • HABs Forum
  • Publications
  • CSI News and Monthly Updates
  • Learning Materials
  • Press
Home Outreach and Education Learning Materials

Learning Materials

• CSI's Water Indicator Information Sheets

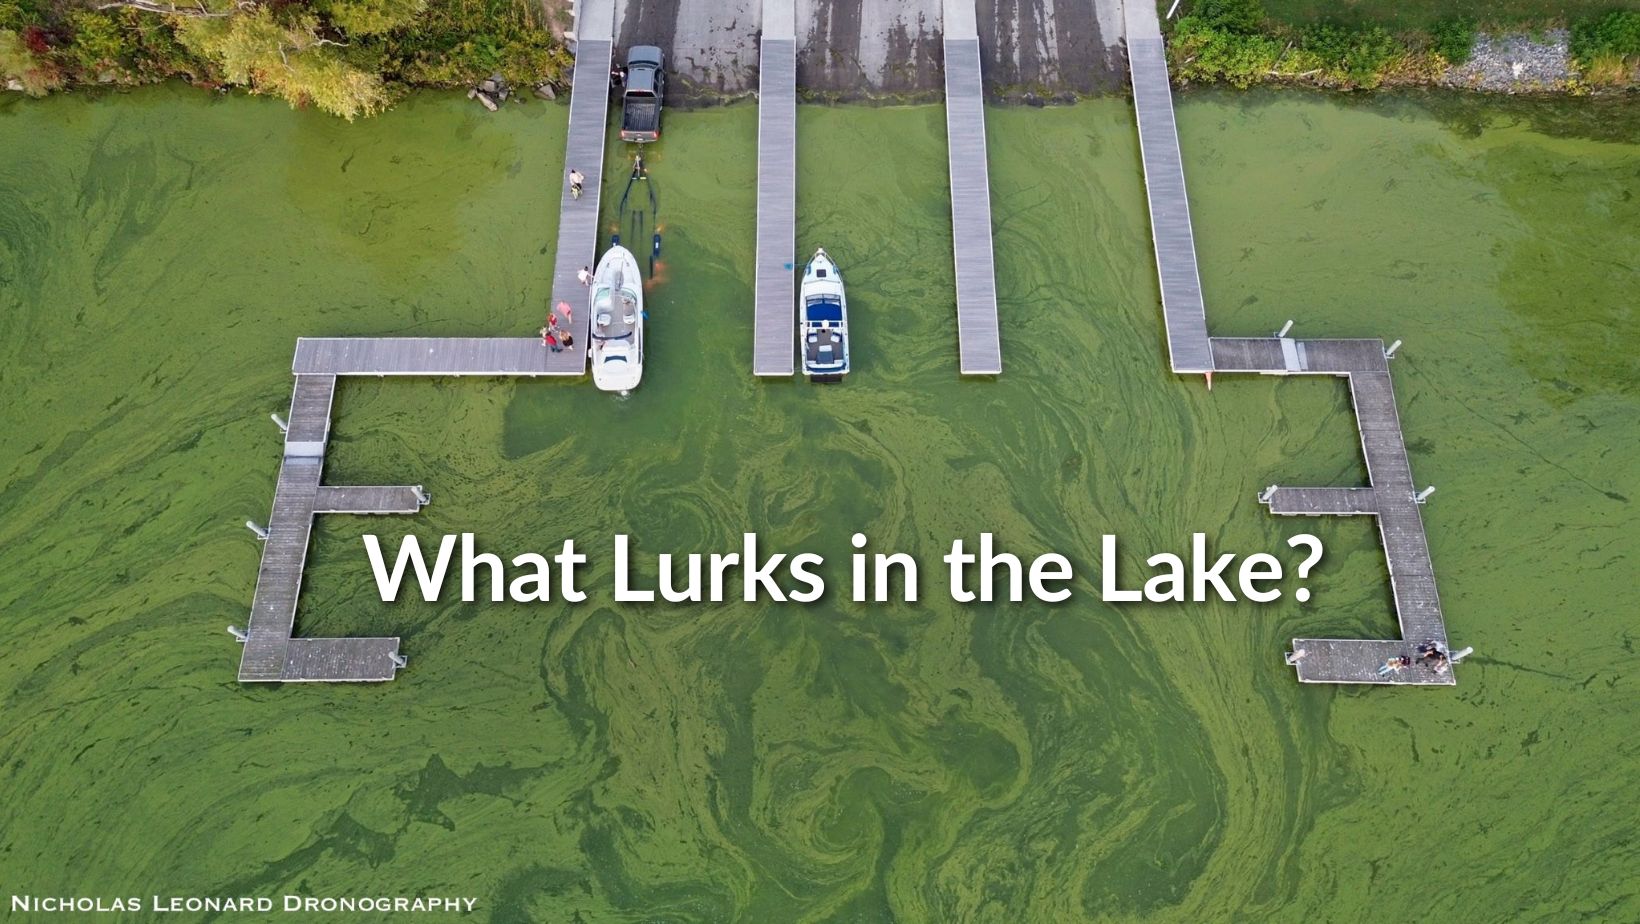
How do we determine whether a stream is “healthy” or water is “clean”? The answer may be more complicated than you would expect. At Community Science Institute, we measure a wide range of water quality indicators. These may also be called “analytes” (things we are analyzing). To help you understand what different results on our database might mean, we’ve put together a fact sheet on each of our analytes. You can download these fact sheets for your own use if you’d like, or just peruse them here.

pH       |       Conductivity       |       Chloride       |       Alkalinity       |       Turbidity

Total Suspended Solids     |     Total Dissolved Solids     |     Nitrogen (Overall)

Nitrate and Nitrite (Nitrogen)     |     Ammonia     |     Total Kjeldahl nitrogen (TKN)

Phosphorus     |     Total Phosphorus    |     Soluble Reactive Phosphorus

Total Hardness    |     Calcium Hardness    |    Temperature    |    PFAS

DO thumbnail

Dissolved Oxygen Fact Sheet

Curious where we get the numbers and facts on these sheets? Check out our reference table to see our sources.

• Water Quality Report Card

The Water Quality Report Card is a new educational tool published by CSI that guides kids and families through a self-led exploration of the aquatic life found in streams and what different types of life indicate about water quality. The report card is a wonderful tool for outdoor and at-home education, providing children and families with the opportunity to learn more about environmental sciences. These guides are free and available upon request. You can pick up a Water Quality Report Card from the CSI’s water testing lab here in Ithaca, or you can also request booklets from CSI by emailing Biomonitoring Coordinator Adrianna Hirtler.

We look forward to helping you get outside, explore your favorite stream, and learn about the amazing world of water!

Click here to download your own Water Quality Report Card!

Need help assembling the booklet? Click here for instructions.

WQRP-frontcover

• Water Quality Report Card Presentation

Are you an educator or parent looking for some help introducing the Water Quality Report Card activity to your students or children? If so, this Water Quality Report Card Training Presentation is for you! Developed by CSI’s Biomonitoring Coordinator, Adrianna Hirtler, this presentation will help you teach basic concepts of stream ecology, benthic macroinvertebrate identification, and the learning activities covered in the Water Quality Report Card.

We love to meet the educators using our learning materials. To view and download the presentation, please submit the form below.

Click here to download the Water Quality Report Card Presentation!

water quality report card

• Guide to Different Types of Graphs

This Guide to Types of Graphs and their Uses is a new educational tool geared toward adults. This simple infographic will guide you through four basic types of graphs. An example is given for each using real data from CSI’s database. Alongside the example is a description of the type of data for which this graph is useful and a description of how it is used effectively in the example. You can refer back to this resource if you are ever unsure of how to best depict trends in data!

Click here to download our guide to different types of graphs and their uses.

• Water Quality Database Scavenger Hunt

The Water Quality Database Scavenger Hunt is a new educational tool geared toward adults. This was published for our Water Quality Database Workshop, an event designed to guide attendees through CSI’s database. By posting it here, free for download, we are inviting you to take this journey through our database on your own time! Once you can find the values and information prompted in this activity, you will be more familiar with navigating our in-depth database.

These questions will also encourage you to think critically about how water quality is (or is not) regulated—don’t expect every prompt to have a simple or straightforward answer! The second page gives a brief overview of a few water quality indicators we use in our sampling. If you have any questions about how to find the answers, please reach out to our Outreach and Programs Coordinator at outreach@communityscience.org.

Click here to download our scavenger hunt and try it on your own!

Connect with Us

The Community Science Institute
Langmuir Lab Building/ Box 1044
95 Brown Rd.
Ithaca, NY 14850

(607) 257-6606

info@communityscience.org

Support Our Work

Donate

Recent Posts

  • Save the Date: “HAB-by Hour” at Cayuga Shoreline

    13 May, 2025
  • New ways to volunteer at CSI in 2025!

    Community Science Institute has long been known for our environmental monitoring partnership

    Loading

    7 March, 2025
Copyright 2007-2016 Community Science Institute | Developed by: Abner X. Figueroa
  • Get Involved
    • Volunteer With Us!
    • Monitoring Partnerships
      • Harmful Algal Bloom Monitoring on Cayuga Lake
      • Synoptic Sampling
      • Biological Monitoring
      • Owego Creek Tributaries Monitoring Project with Trout Unlimited
      • Past CSI Monitoring Programs
        • Red Flag Monitoring
    • Outreach and Education
      • Public Events and Presentations
      • Publications
      • The Water Bulletin Newsletter
      • CSI News and Monthly Updates
      • Journey of Water
      • Learning Materials
  • I want to test my water
    • Potable and Non-Potable Water Tests & Fees
    • Drinking Water Resources for the General Public
  • CSI Water Quality Data
    • Database Home
    • Streams and Lakes Data
      • Cayuga Lake Region
      • Seneca Lake Region
      • Upper Susquehanna River Region
      • Select and Download Streams and Lakes Data
    • HABs Database
      • Select and Download Cayuga Lake HABs Data
    • Pre-Fracking Groundwater Baselines
      • Select and Download Groundwater Baselines
    • Biological Monitoring Results
    • Glossary
  • About Us
    • Meet Our Staff
    • Employment Opportunities
    • Meet Our Board of Directors
    • Annual Reports
    • Frequently Asked Questions
    • Contact Us
  • Donate
    • CSI’s Business Membership Program
    • 2025-2026 Business Membership Partners
Community Science Institute
X