Community Science InstituteCommunity Science InstituteCommunity Science InstituteCommunity Science Institute
  • No Menu Set

Synoptic Sampling

  • Synoptic Sampling
  • Red Flag Monitoring
    • Red Flag Monitoring Symposium
  • Biological Monitoring
    • BMI Results
  • Harmful Algal Bloom Monitoring on Cayuga Lake
    • Harmful Algal Bloom Datasets
  • Owego Creek Tributaries Monitoring Project with Trout Unlimited
  • Past CSI Monitoring Programs
Home Monitoring Partnerships Synoptic Sampling

Synoptic Sampling

The Synoptic Sampling partnership is CSI’s longest-running volunteer water monitoring program, beginning in 2002 in the Fall and Virgil Creek watersheds.

The goal is twofold: produce ongoing data that informs water resource management decisions by local government while simultaneously educating and empowering citizens to become stewards of their local environment.

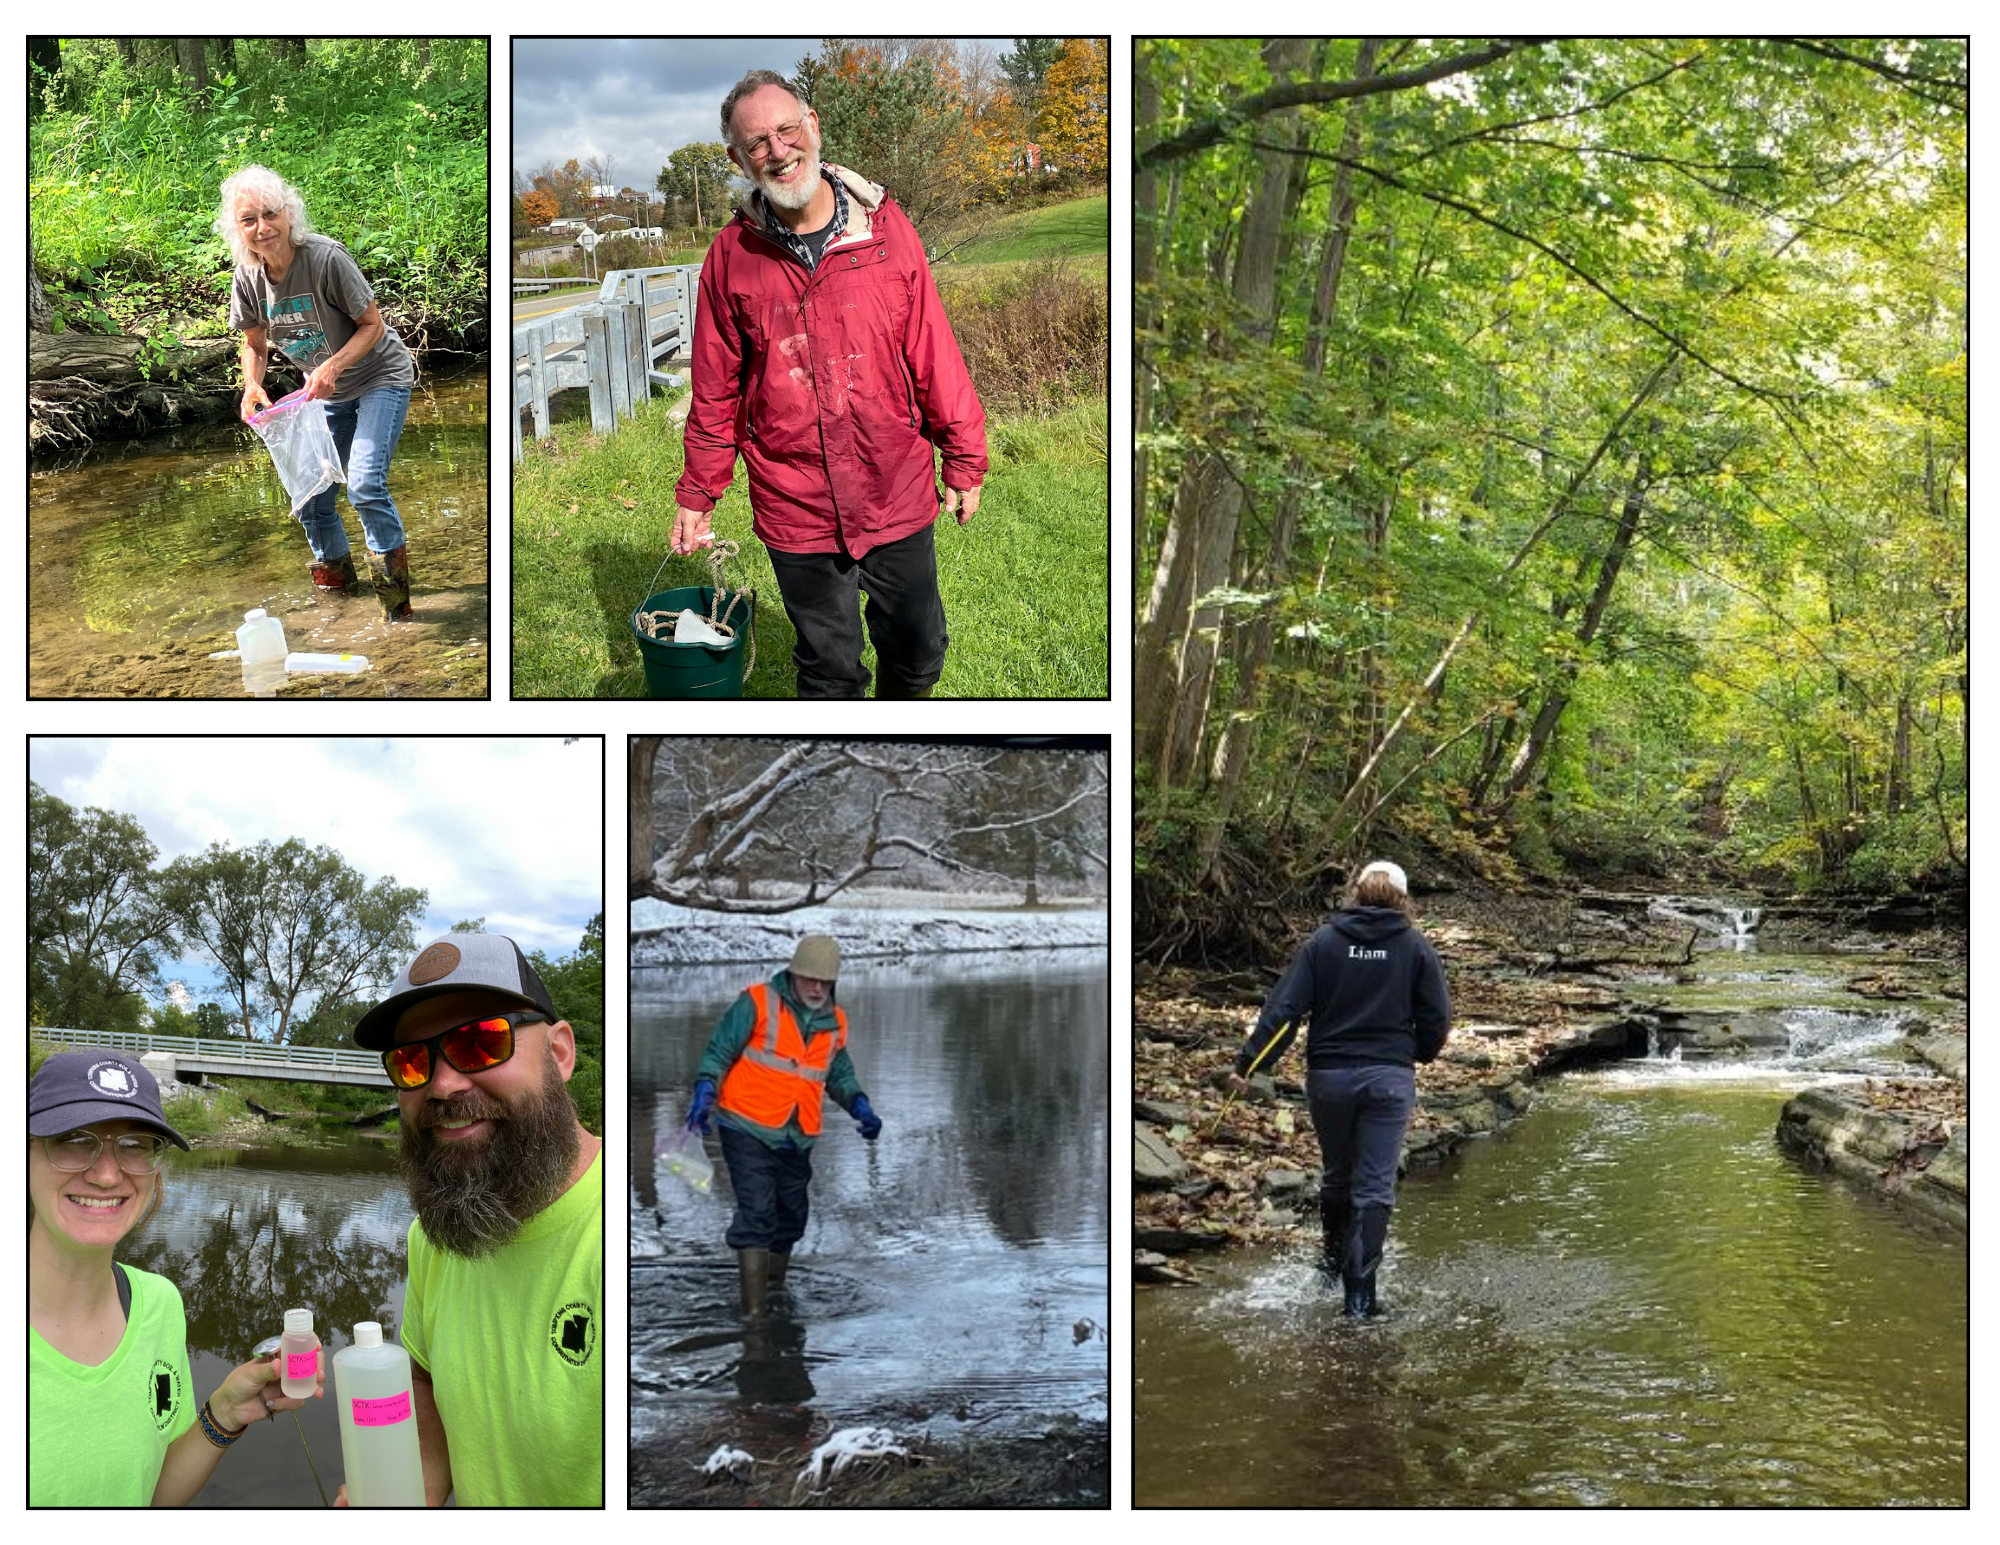
CSI’s synoptic sampling volunteers are active in the Cayuga Lake and Seneca Lake watersheds.

What do Synoptic Sampling volunteers do and how often do they do it?

Groups of volunteers are organized into teams that collect stream samples several times a year at fixed locations within a single watershed. These samples are collected “synoptically.” The term “synoptic monitoring” means that data gathered during these efforts is collected on the same day, within a few hours, to ensure that stream flow and meteorological conditions are consistent across all locations. This approach provides a comprehensive yet succinct understanding of the waterbody being sampled. Volunteers collect samples, measure water temperature on-site, complete chain-of-custody sheets, and transport samples on ice to the CSI lab for certified chemical and bacteriological analyses.

Synoptic sampling volunteer groups sample 3 times per year. CSI aims to arrange two base flow events and one storm water event for each watershed. The time commitment involved is 2-3 hours per monitoring event. The time commitment involved is 2-3 hours per monitoring event.

Our synoptic stream volunteers are a hardy crew, monitoring their assigned stream sites from March-November in potentially all kinds of weather conditions. Safety is paramount though, and if conditions are unsafe, we do not expect anyone to collect samples until conditions improve.

What are Synoptic Sampling volunteers monitoring for?

Sediment entering Cayuga Lake after a rain storm. Photo by Bill Hecht

The synoptic sampling partnership is a traditional water monitoring program that includes a number of indicators of agricultural and residential development impacts, including: pH, alkalinity, turbidity, inorganic and organic nitrogen, phosphorus (both dissolved and total), E. coli (indicator for pathogenic bacteria), chlorides, total suspended solids, specific conductance, and total hardness. The photo to the left shows sediment plumes going into Cayuga Lake after a heavy rain. Monitoring after rain storms helps us learn about how much sediment is traveling into Cayuga Lake and where it is coming from.

Many of the aforementioned parameters double as indicators of contamination from shale gas wells. In an effort to establish more comprehensive baseline data for watersheds that may be affected by hydrofracking, CSI’s synoptic partnership added the following hydrofracking indicators at selected locations from 2012 – 2014: total dissolved solids, chemical oxygen demand, MBAS (surfactants), barium, strontium and gross alpha and beta radioactivity. CSI stopped monitoring the “hydrofracking indicators” following the implementation of New York State’s hydrofracking moratorium in 2015. The baseline dataset is still publicly available in CSI’s database.

Where are volunteers currently monitoring?

Currently, the vast majority of CSI’s synoptic sampling partnerships are in the Cayuga Lake and Seneca Lake watersheds.  Volunteers monitor Fall Creek, Virgil Creek, Six Mile Creek, Salmon Creek, Trumansburg Creek, Taughannock Creek, the Cayuga Inlet (including Enfield, Buttermilk and Cascadilla Creeks), as well as several small streams that flow directly to Cayuga Lake including Yawger Creek and Great Gully. In the Seneca Lake watershed, volunteers monitor Catherine Creek, Big Stream, Kashong Creek, Keuka Outlet, and Reeder Creek.

All locations can be viewed in the CSI Streams & Lakes Database, along with data going back to 2002 –  over 87,000 certified data items to date. Click on the site map to enlarge.

If you’re interested in volunteering with CSI’s Synoptic Sampling program, email us at info@communityscience.org.

Click to enlargen.

Connect with Us

The Community Science Institute
Langmuir Lab Building/ Box 1044
95 Brown Rd.
Ithaca, NY 14850

(607) 257-6606

info@communityscience.org

Support Our Work

Donate

Recent Posts

  • Why we volunteer as HAB Harriers

    Please enjoy this article written by one of CSI’s longterm HABs Harriers,

    18 August, 2025
  • Save the Date: “HAB-by Hour” at Cayuga Shoreline

    13 May, 2025
Copyright 2007-2016 Community Science Institute | Developed by: Abner X. Figueroa
  • About Us
    • Alyssa Johnson
  • Adrianna Hirtler
  • Aleah Young
  • Annual Reports
  • Baseline Testing
  • Bill George
  • Biological Monitoring
  • Biological Monitoring Results
  • Bloom Form
  • Calendar
  • Cayuga Lake 2018 Harmful Algal Blooms Results
  • Cayuga Lake 2019 Harmful Algal Bloom Results
  • Certified Water Testing
    • Non-Potable Water Tests & Fees
    • Potable and Non-Potable Water Tests & Fees
  • Contact Us
  • CSI Data Updates
  • CSI News Archive
  • CSI-Volunteer Database
    • Database Home
    • Pre-Fracking Groundwater Baselines
      • Select and Download Groundwater Baselines
    • Streams and Lakes Data
      • Cayuga Lake Region
      • Select and Download Streams and Lakes Data
      • Seneca Lake Region
      • Upper Susquehanna River Region
  • CSI’s Business Membership Program
  • Dan Pascucci
  • Drinking Water Resources for the General Public
  • Employment Opportunities
  • FAQ – Testers!
  • Frequently Asked Questions
  • Get Involved
  • Glossary
  • Grascen Shidemantle
  • Home
  • Homepage
  • I want to test my water
    • Glossary
  • Journey of Water
    • Young Scientists
  • Kathryn Graham
  • Katia Appel
  • Logout
  • Lost Password
  • Maps
  • Meet Our Board of Directors
  • Meet Our Staff
  • Membership Form
  • Monitoring Partnerships
    • Biological Monitoring
      • BMI Results
    • Harmful Algal Bloom Monitoring on Cayuga Lake
      • Harmful Algal Bloom Datasets
    • Owego Creek Tributaries Monitoring Project with Trout Unlimited
    • Past CSI Monitoring Programs
    • Red Flag Monitoring
      • Red Flag Monitoring Symposium
    • Synoptic Sampling
  • Noah Mark
  • Outreach and Education
    • CSI News and Monthly Updates
    • Learning Materials
    • Press
    • Public Events and Presentations
      • Drinking Water Wednesdays
      • HABs Forum
    • Publications
    • The Water Bulletin Newsletter
  • Rama Hoetzlein
  • Report a HAB
  • Resources
    • Water Quality Resources
    • What’s In Your Watershed? Series
  • Resources
  • Seth Bingham
  • Stephen Penningroth
  • Test Events Page
  • Volunteer With Us!
  • Water Testing Payments
  • Reports
  • Gas Well “Signature Chemicals”
    • Baseline Testing
      • FAQ – Baseline Testing
    • Regional Baseline Initiative
  • Volunteer Partners
    • Funding
  • Donate
    • 2025-2026 Business Membership Partners
  • Blog Medium View
  • database.communityscience.org
  • Message Box
  • Icon
  • Code
  • Qoute
  • Testimonials
  • Team
  • Divider
  • List
  • sliders
  • Font awesome icons
  • Password Protected
  • Gallery
    • Gallery 4 Column
    • Gallery 3 Column
    • Gallery 2 Column
    • Gallery Masnory View
  • Events
    • Events With Filterable
    • Events Right Sidebar
  • Blog
    • Blog Right Sidebar
  • Highlight
  • Dropcap
  • Map
  • Tables
  • Tabs
  • Accordion & Toggle
  • Buttons
  • Images
  • Video
  • Typography
  • Columns
  • Home
  • Services
  • Contact Us
Community Science Institute
X