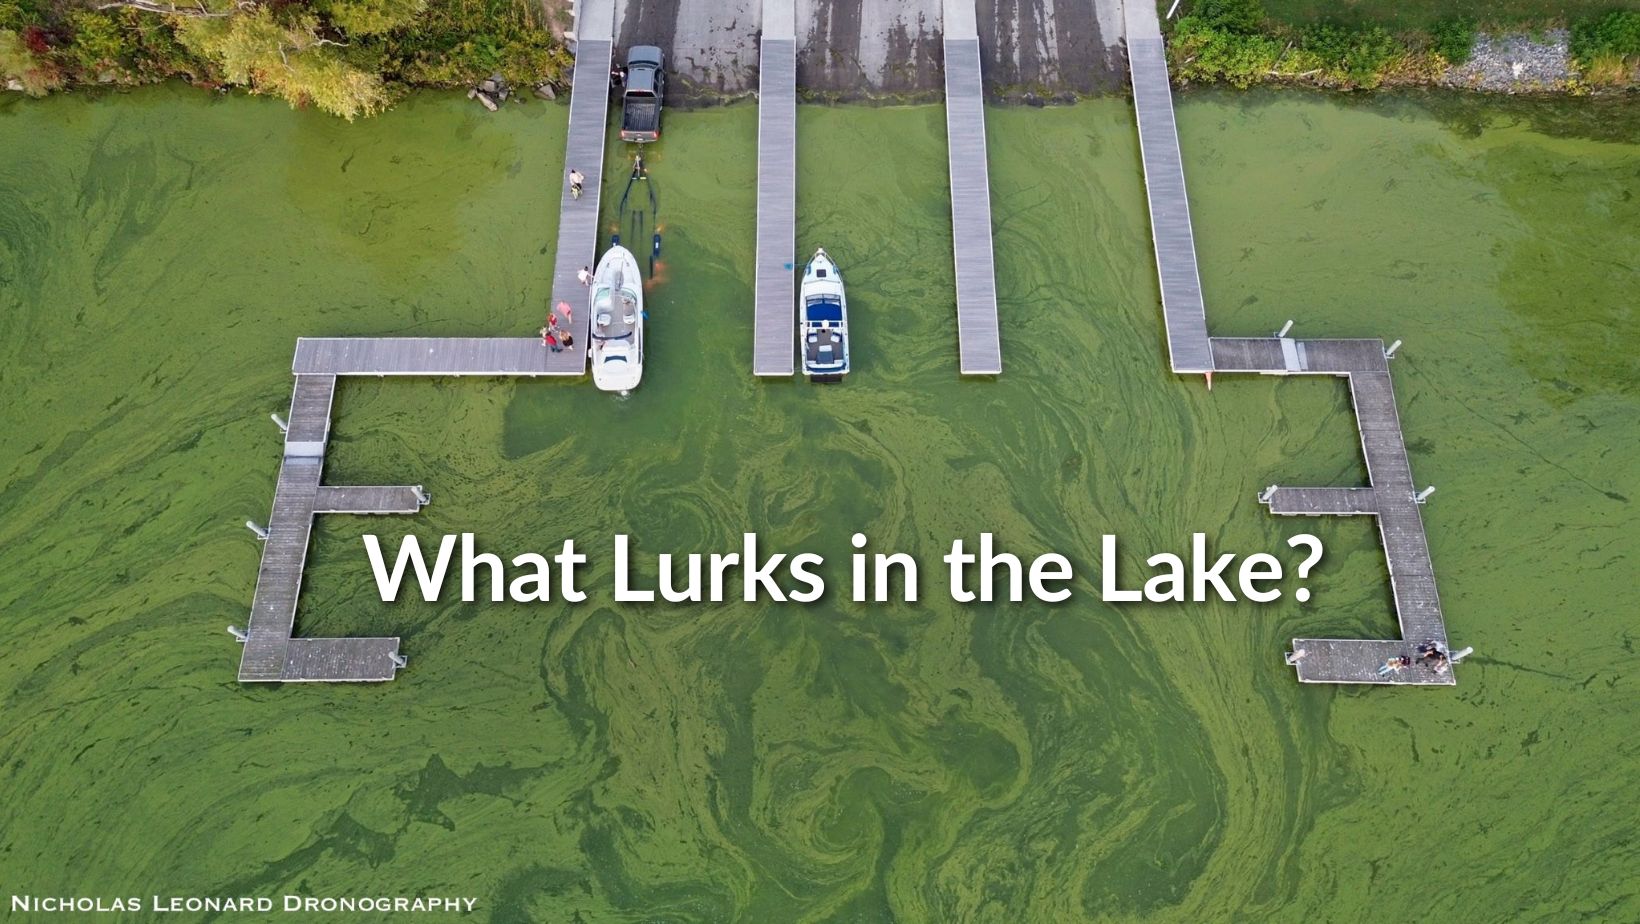
Cayuga Lake 2019 Harmful Algal Bloom Results
Cayuga Lake 2019 HABs Reporting Page
The Cayuga Lake Cyanobacteria Reporting Map serves as an interactive resource for all cyanobacteria blooms on Cayuga Lake. Click on an icon to view a description of the bloom including photos as well as test results from the CSI lab.
We recommend viewing the map in full screen mode in order to see all the information provided. Click on the broken box in the upper right hand corner of the map. This will open the full screen map in a new tab.
Guide to Map Icons
Colored icons indicate the microcystin toxin status of the cyanobacteria bloom. The dates of the bloom can be found by clicking on the bloom icon, or on the side menu when viewing the map full screen.
Cyanobacteria Bloom (HAB) Microcystin Toxin Status
Black – Cyanobacteria are present in bloom (HAB) sample. Microscopic examination indicates the presence of cyanobacteria and therefore the potential for the bloom to be harmful. Results of microcystin toxin analysis are pending.
Blue – Cyanobacteria are present in bloom (HAB) sample. Microscopic examination indicates the presence of cyanobacteria and therefore the potential for the bloom to be harmful. Analyses of microcystin toxin and total chlorophyll a have not been performed because the bloom is suspected of being part of another bloom close by that has already been analyzed; or because the lab received many bloom samples in a short period of time, lacked the resources to test all of them and therefore prioritized testing based on public health risk considerations.
Green – Cyanobacteria bloom with a microcystin toxin concentration less than the drinking water limit (0.3 ug/L).
Yellow – Cyanobacteria bloom a microcystin toxin concentration in between the drinking water limit (0.3 ug/L) and the limit for contact recreation (4.0 ug/L).
Red – Cyanobacteria bloom with a microcystin toxin concentration that exceeds the limit for contact recreation (4.0 ug/ L).
Note: While microcystin is the most common cyanotoxin found in New York, it is only one of several harmful chemicals that may be associated with cyanobacteria blooms (HABs). To minimize risk, avoid contact with all suspicious blooms. If possible, report suspicious blooms online, to habshotline@gmail.com, or by calling the CSI lab at (607) 257-6606. You will be contributing to a better understanding of the HABs phenomenon and how to manage it.
Locations, information and the test results of all harmful algal blooms (HABs) that occur on Cayuga Lake are sent by CSI to the New York State Department of Environmental Conservation (NYSDEC). This data is reported by the NYSDEC on the state-wide NYHABs Reporting Page.
Cayuga Lake HABs Information and Master Results Table
How to Open and Read the Master Table of Results
Click link to view detailed Cayuga Lake HABs information and test results in table format.
Note: Table opens in a new tab as a google spreadsheet. You can download the spreadsheet as an excel file to manipulate the data, i.e. data sorting, graphing, cell highlighting, etc.
Increase table size by clicking on the percentage button in the upper left-hand corner of the spreadsheet. Decreasing the percentage will zoom out the table.
The first three columns and first three rows are frozen so that you can more easily scroll through results without losing track of the sample you’re interested in.
Understanding the Master Table of Results
The table is broken up into three major sections: Basic Bloom Information (green), Bloom Location Information (gray), CSI Analyses (shades of blue). Samples that are collected and dropped off at CSI are assigned a unique Bloom Sample Code, which follows the format:
19-ZONE-B#
In this format “19” stands for the year 2019 and is present in all of the bloom codes from the 2019 season.
In the ZONE section will be the code corresponding to the zone in which the sample was collected (see map with zone polygons). Each zone code follows the format 34##, where 34 is the lake code for Cayuga Lake. Codes for each monitoring zone are assigned from 3401 onward.
On the map with zone polygons, zone codes are followed by the name of the HABs Harrier(s) assigned to monitor that specific section of shoreline.
The last two digits of the bloom sample code indicates whether it is the first, second, etc. bloom found in that particular zone. For example, the third suspicious bloom sample collected in 2020 from zone 3426 would be 19-3426-B3. The bloom sample code is the best way to identify a sample and track results in the table.
Basic bloom information, location information, and results of CSI analyses will be updated continuously. “Results Pending” will be listed for results which are not yet available.
CSI Laboratory Analyses
The CSI lab is equipped to perform three analyses on suspicious blooms: microscopy, total chlorophyll a, and microcystin. If initial inspection under the microscope confirms the presence of cyanobacteria in the bloom, then total chlorophyll a and microcystin analyses are performed.
Microscopy
- All samples received by the CSI lab are first assessed by microscopy, carefully looking at samples under the microscope, to characterize general bloom composition and determine if cyanobacteria are present in the bloom.
Total Chlorophyll a
- If cyanobacteria are present, total chlorophyll a is used to estimate the biomass of the cyanobacteria bloom. Total Chlorophyll a is determined using spectrophotometry and results are reported in units of parts per billion (ppb) or micrograms/liter (ug/L).
Microcystin
- Cyanobacteria produce a variety of natural chemicals, a few of which are harmful to other species, including humans. The most common harmful chemical found in New York is microcystin. Detailed toxicity studies have not been performed, and there is not yet a consensus on acceptable exposure levels. The New York State Department of Health (NYSDOH) has set safe limits for public drinking water supplies at 0.3 ug/L and for public swimming beaches at 4.0 ug/L (EPA, 2017). The New York State Department of Environmental Conservation (NYSDEC) defines a “bloom with high toxin” as 20 ug/L near the lake shore and 10 ug/L in open water (NYSDEC HABs Program Guide, Section 3).
- Microcystin toxin is measured using EPA Method 546 which is an enzyme-linked immunosorbent assay (ELISA). CSI reports results down to the drinking water standard of 0.3 ug/L (EPA, 2015).
Recent Posts
-
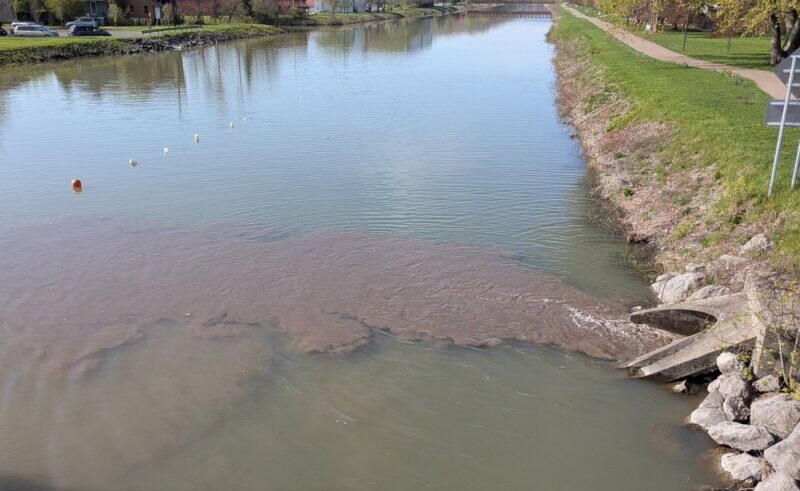
From Community Report to Regulatory Action: How One Cayuga Inlet Observation Triggered a Rapid Scientific Response
CSI’s Outreach & Programs Coordinator, Alyssa Johnson, collects a sample from Cliff
 6 May, 2026
 -