Biological Monitoring
Biological Monitoring
Menu
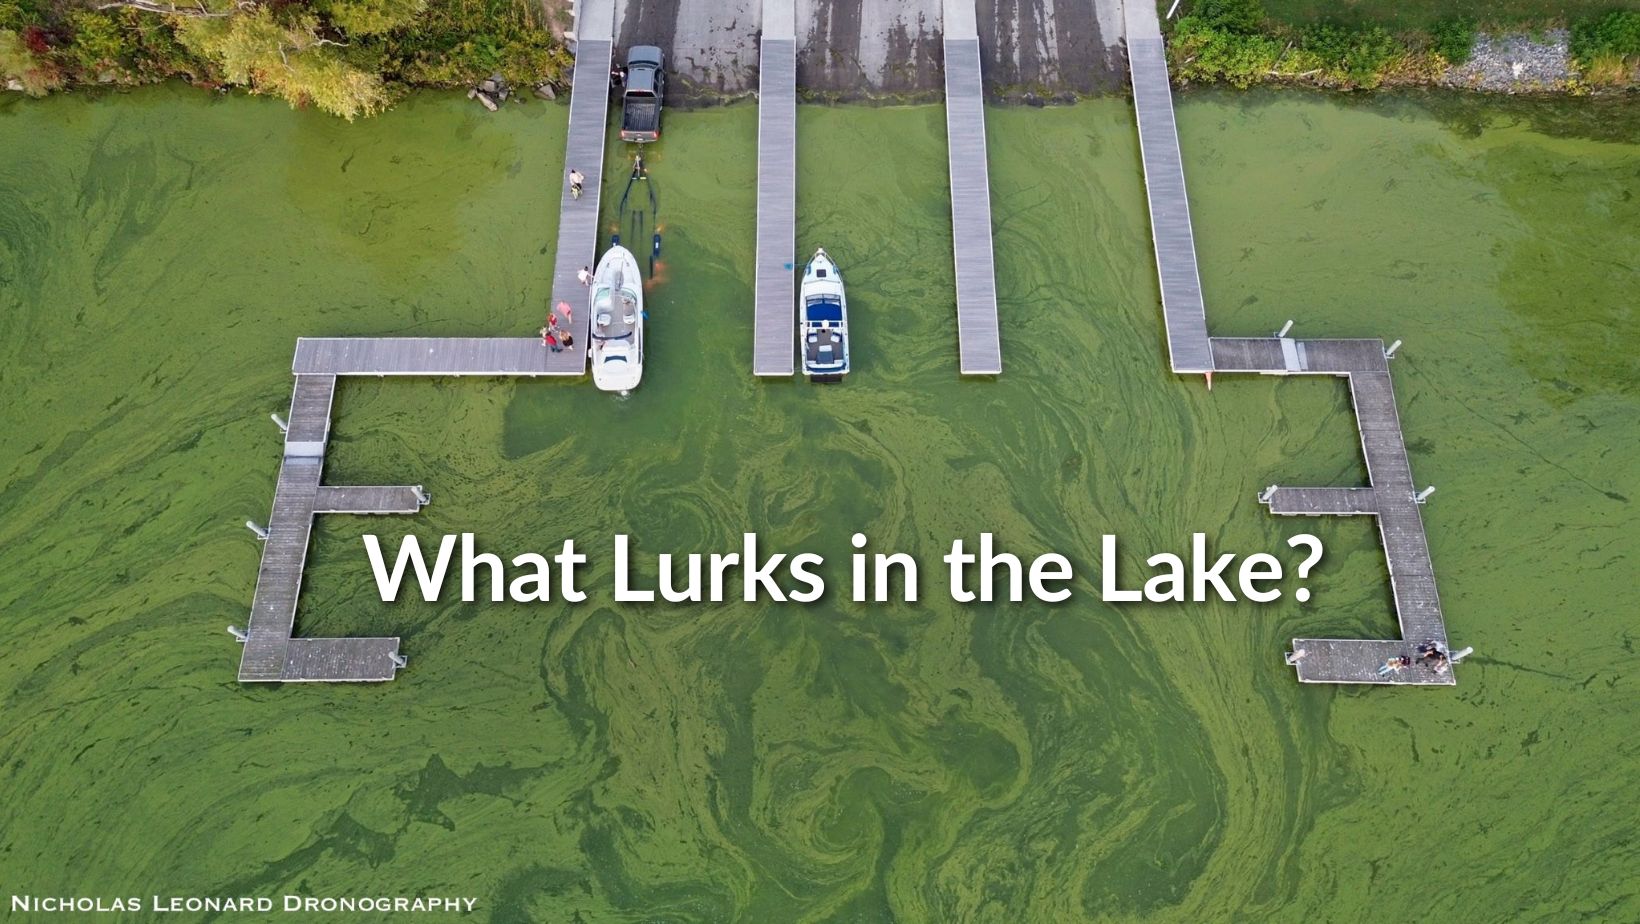
Biological monitoring (or biomonitoring) is a fun, affordable, and effective approach to stream monitoring. It is a process of looking at a biological community in order to assess the overall “health” of an ecosystem such as a stream. Benthic macroinvertebrates (aquatic insects and other small stream-dwelling organisms) are often used for this purpose since they are found in all streams (except under extremely degraded conditions) and are relatively easy to collect. Many conservation organizations such as the New York State Department of Environmental Conservation (NYSDEC) and Izaak Walton League have established protocols and metrics for translating the composition of a BMI community into a water quality rating. Bio-monitoring gives a reliable, cost-effective, overall picture of water quality in a stream and is a great realm for citizen science engagement.
")

What do biological monitoring volunteers do and how often do they monitor?
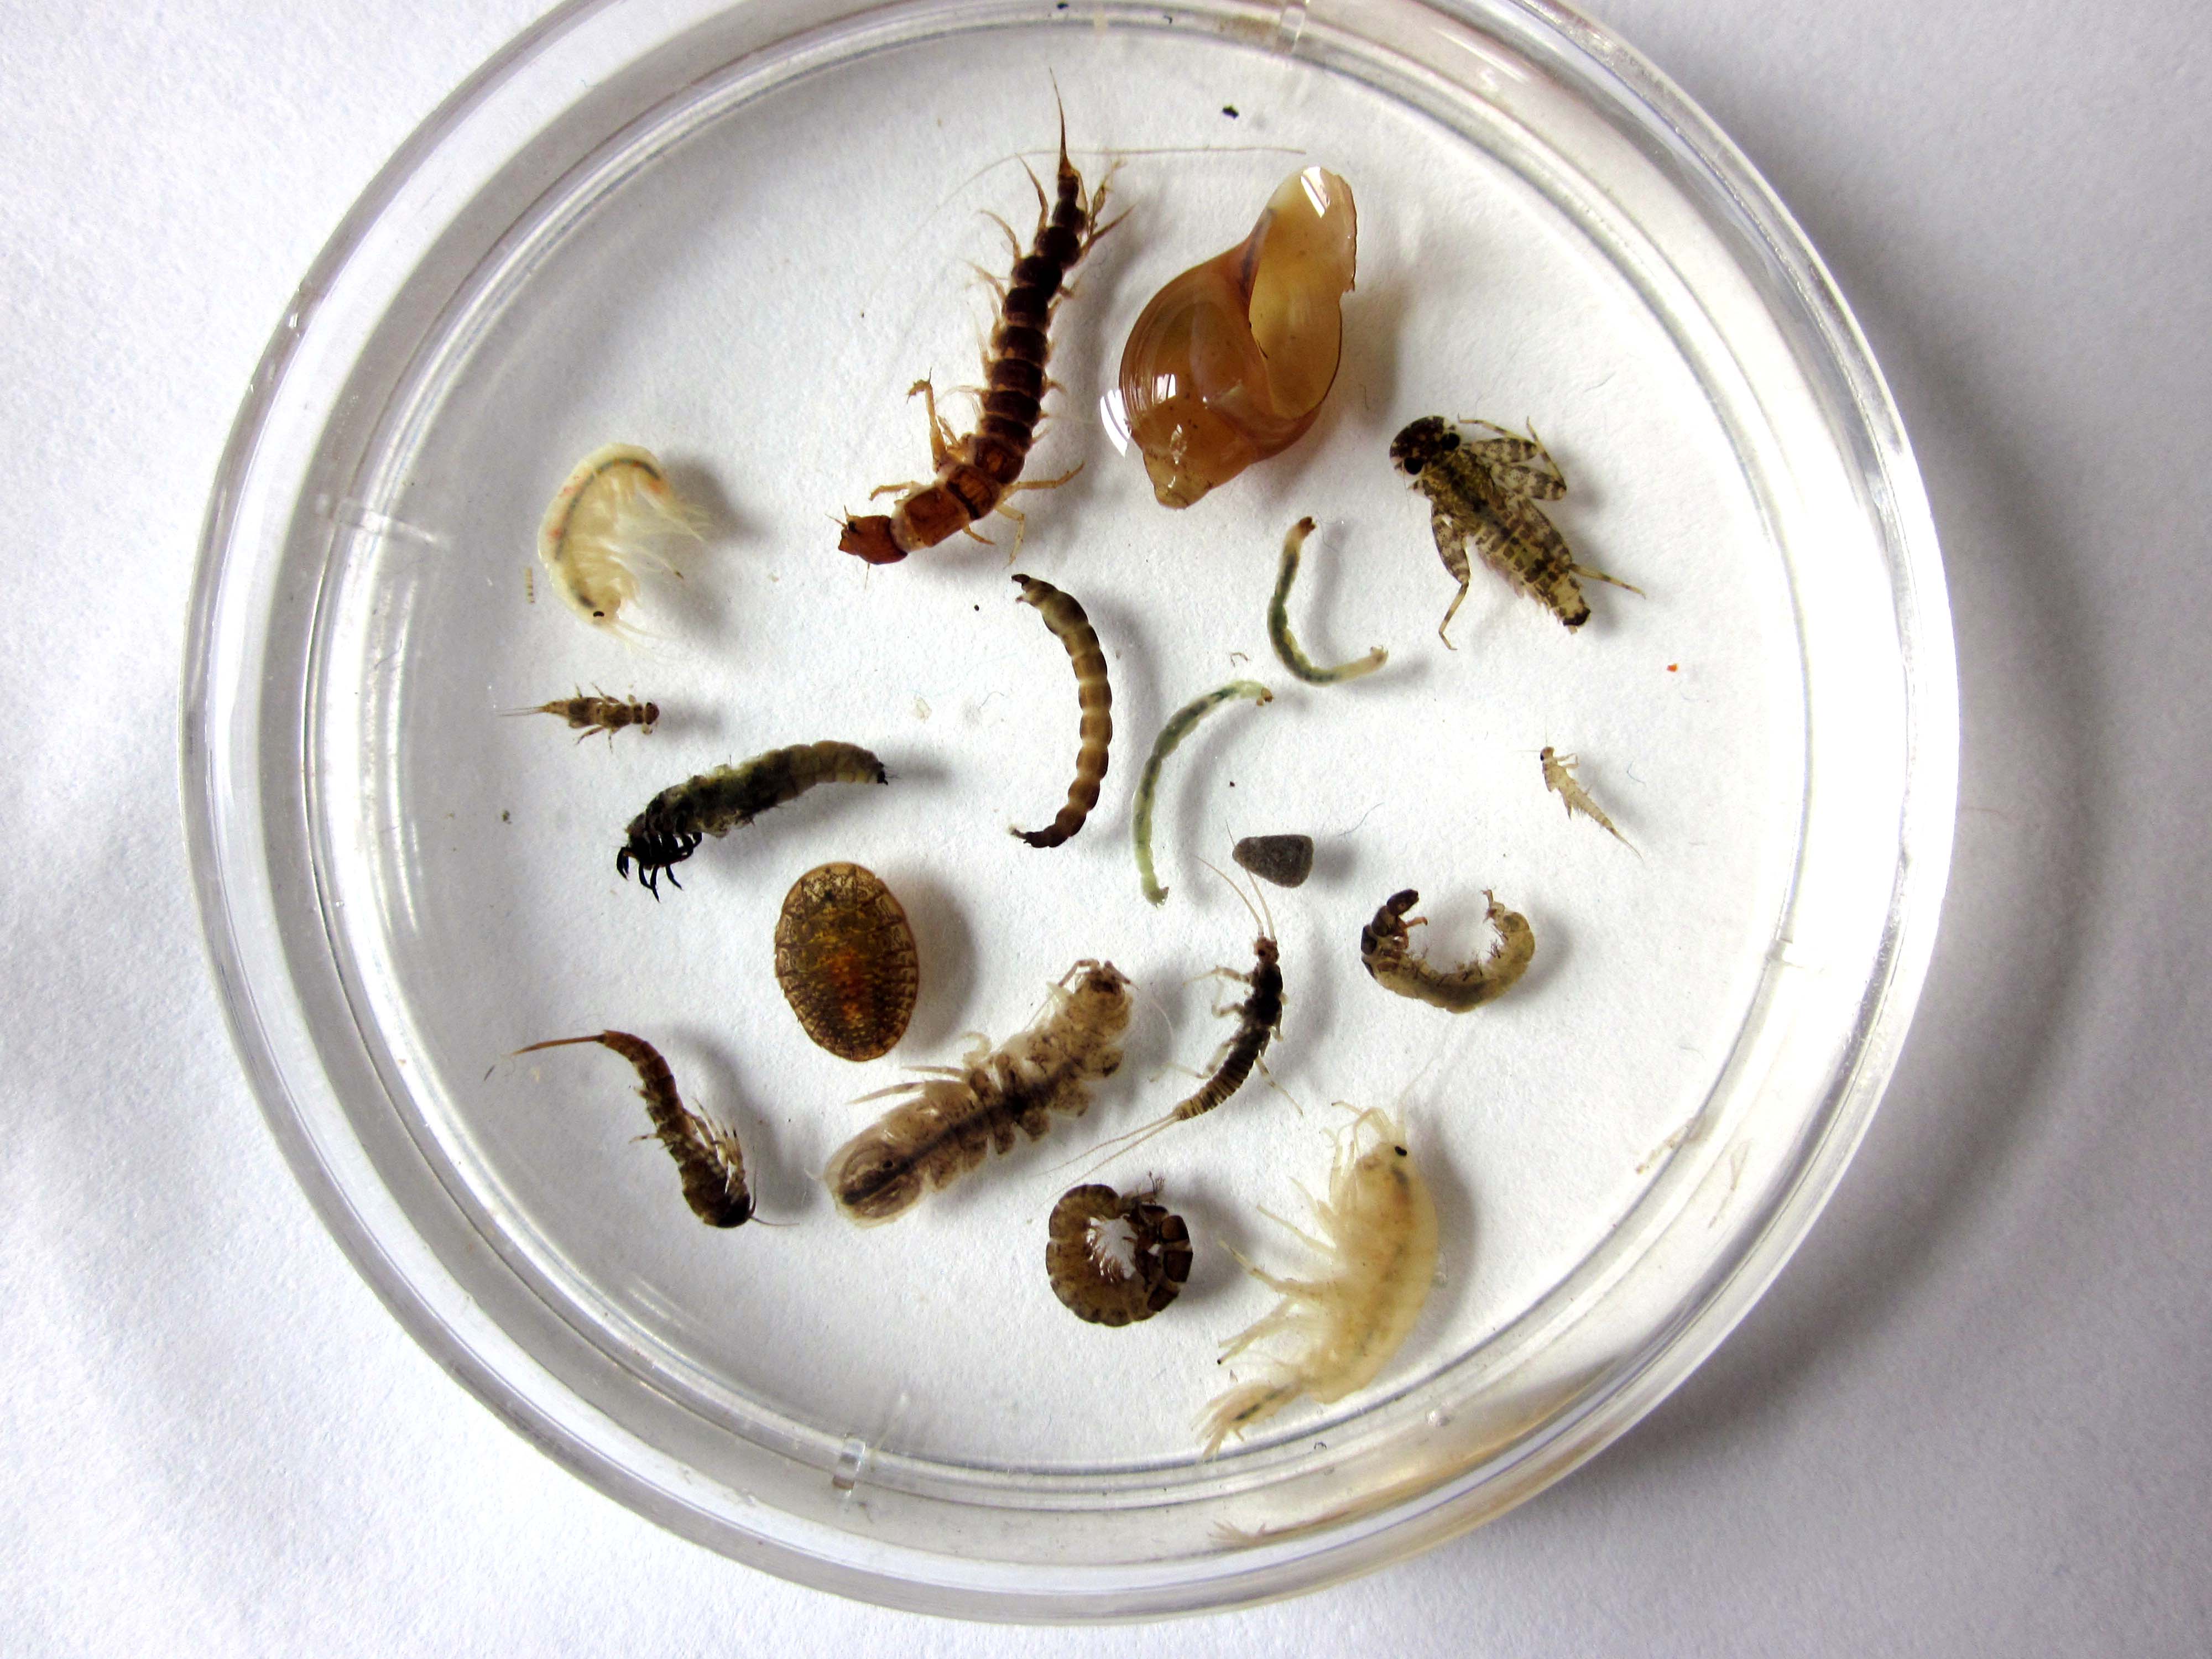
Biomonitoring volunteers are trained by CSI staff in BMI sample collection and analysis, adhering to a modified version of protocols developed with NYSDEC input by a conservation group called Hudson Basin River Watch. Samples are collected following the same protocols used for professional stream assessments conducted by the NYSDEC, which involves collection of stream bottom samples in a kick net across a 5 meter transect in a stream riffle habitat. Samples are usually preserved in isopropyl alcohol for later analysis, though some volunteer groups collect and analyze live samples on the same day. Volunteers randomly select a sub-sample from which they pick out, identify and count every organism. Most samples are identified to family level. Once organisms are sorted, identified and counted, several metrics are calculated as indices of stream health. Four of these metrics are then combined into one number, the Biological Assessment Profile (BAP), which gives an overall water quality rating for that stream segment.
CSI volunteers aim to collect BMI samples once per year along stream reaches where long-term characterizations of overall stream health are desired. Some sites may be monitored less often, simply to check in with water quality at a specific point in time. BMI monitoring gives a good overall evaluation of water quality over the past year or so for a reach of stream upstream of a sampling location.
When and where is biological monitoring conducted?

Summer is the best time to collect BMI samples in terms of the use of all of the NYSDEC-developed metrics (they were developed during the NYSDEC sampling season of July 1-September 30), though BMI are active year-round and can theoretically be sampled at any time. At CSI we try to focus most sampling within the NYSDEC sampling season to make the best use of metrics and sampling conditions, but sampling done outside of the sampling season can also produce valuable results. For longer-term monitoring of a stream, volunteers try to sample annually at roughly the same time of year.
CSI staff have supported volunteers in collecting and analyzing BMI samples in Cayuga Lake, Seneca Lake, Owasco Lake and Upper Susquehanna River watersheds. From 2016 to 2018 biomonitoring was our fastest growing volunteer program! Check out the map to the left to see where volunteers have collected samples in the Finger Lakes region.
What can biological monitoring tell us about water quality and how is the analysis conducted?

Biological monitoring of BMI communities in streams can give us a good sense of water quality, in terms of suitability for supporting life, over time. While chemical monitoring (like the monitoring conducted by CSI’s synoptic and Red Flag volunteers) is an excellent way to characterize certain aspects of water quality at a particular point in a stream at a specific point in time, biomonitoring gives an overall sense of water quality in a stream segment over the preceding year or so. Many of the organisms live for months or years in the same stretch of stream and different families of organisms have different levels of tolerance for degraded conditions. Various metrics are applied to BMI organism counts, and these are used to characterize the stream segment as having “no impact,” “slight impact,” “moderate impact,” or “severe impact” – corresponding to water quality categories developed by the NYSDEC. The biomonitoring results produced by CSI volunteers, when all protocols are properly adhered to, are comparable to professional stream biomonitoring results produced by the NYSDEC.
What is done with BMI monitoring results?
Many biomonitoring results are currently accessible to the public on the biomonitoring results page. A new online, searchable database specifically for BMI results is in the works! BMI results have been used to complement chemical monitoring data in efforts to bring attention to degraded conditions in particular stream segments, to help identify sources of pollution in impacted streams and also to document the high quality of water currently found in most area streams. Documentation of good water quality is particularly important should conditions change in the future. Sometimes BMI results bring attention to sites where more specific chemical monitoring might be warranted.
How is a BMI sample evaluated? What are the metrics?
Once the benthic macroinvertebrates in a stream sample have been picked, sorted and identified under a dissecting microscope to the level of order and family, they can be used to assess the health of the stream as a home for aquatic life. The assessment is based on which orders and families of insects are present and how well they tolerate degraded conditions. There are five main metrics used to evaluate stream health.
Total Family Richness
A count of the number of different families of aquatic insects in the sample. It is an indication of how diverse the macroinvertebrate community is in the stream. The more different families of insects there are (higher richness), the healthier the stream.
Values: >13 = non-impacted,
10-13 = slightly impacted,
7-9 = moderately impacted,
<7 = severely impacted
Family Biotic Index
Macroinvertebrate families vary widely with respect to how well they tolerate pollution. Some are very sensitive to pollution while others are quite tolerant of polluted conditions. This metric is based on the pollution tolerance of families of benthic macroinvertebrates on a scale of 0 to 10.
Values: 0-4.5 = non-impacted,
4.51-5.50 = slightly impacted,
5.51-7.00 = moderately impacted,
7.01-10.00 = severely impacted
EPT Richness
A count of the total number of macroinvertebrate families of:
mayflies (Ephemeroptera),
stoneflies (Plecoptera),
and caddisflies (Trichoptera)
found in a sub-sample.
These three orders of macroinvertebrates are considered to be mostly clean-water organisms, and the presence of several families from these three orders is generally correlated with good water quality.
Values: >7 = non-impacted,
3-7 = slightly impacted,
1-2 = moderately impacted,
0 = severely impacted
Percent Model Affinity
The New York State Department of Environmental Conservation has established what a typical, or model, community of benthic macroinvertebrates looks like in a healthy, non-impacted stream in New York. The Percent Model Affinity metric indicates how similar a BMI sample is to the model New York BMI community, as defined by the NYSDEC. It is based on the relative abundance of 7 major groups of benthic macroinvertebrates.
Values: >64% = non-impacted,
50-64% = slightly impacted,
35-49% = moderately impacted,
<35% = severely impacted

Biological Assessment Profile
This metric combines Total Family Richness, Family Biotic Index, EPT Richness and Percent Model Affinity in a single metric called the Biological Assessment Profile (BAP). Each of these four metrics is converted to a value from 0 to 10 using a mathematical equation. The four converted values are averaged, and the average represents the overall water quality for the sampling location.
Resources for Biomonitoring Volunteers
- Rough Guide To BMI-2015
- BMI Protocol Sheet
- Physical Survey Sheets
- Family-Level Identification Data Sheets
- Comparison of BMI Sampling Techniques
- 2004 Hudson Basin River Watch Guidance Document
If you are interested in volunteering with CSI’s biological monitoring program or would like more information, contact Adrianna Hirtler, Biomonitoring Coordinator, at adrianna@communityscience.org.