Community Science InstituteCommunity Science InstituteCommunity Science InstituteCommunity Science Institute
  • No Menu Set

Testing Cayuga Lake with the Floating Classroom

    Home Cayuga Lake Watershed Testing Cayuga Lake with the Floating Classroom
    NextPrevious

    Testing Cayuga Lake with the Floating Classroom

    By abnerx | Cayuga Lake Watershed, News | Comments are Closed | 3 September, 2014 | 0

    Most of CSI’s efforts in the Cayuga Lake watershed go towards monitoring streams and creeks that flow into Cayuga Lake. Twice a year, CSI partners with the Floating Classroom to collect samples from Cayuga Lake itself, testing for the same parameters as in the streams.  The trip out on the lake is one of the highlights of the 4-H20 Youth Science Club, whose participants have the opportunity to come on the boat with their families.

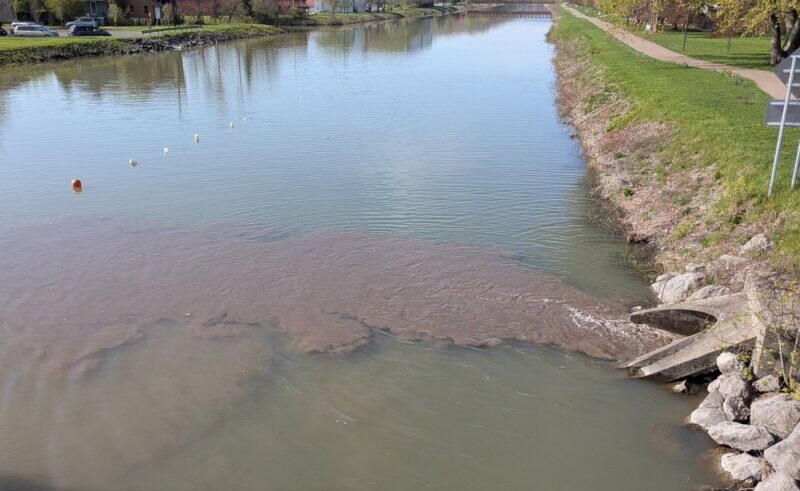
    Collecting samples from tributary streams like Fall Creek, Salmon Creek, and Trumansburg Creek is crucial for understanding how land use impacts each watershed, how much pollution is present, and how quickly pollutants move through the watershed into the lake. Samples from Cayuga Lake show us if and how much the lake is being impacted by tributary streams.

    One might expect that water quality in the lake would be some kind of average of the water quality in all of the streams, but it’s not that simple. Cayuga Lake is the longest of the Finger Lakes at just under 40 miles. Its surface area is 66 square miles, roughly the size of the Towns of Newfield or Lansing. Formed by melting glaciers during the last Ice Age, the east and west sides are steep and the north and south ends are shallow. With nearly 2.5 trillion gallons of water (2,499,535,920,000 give or take a few) Cayuga Lake varies quite a bit in its quality depending on where you look.

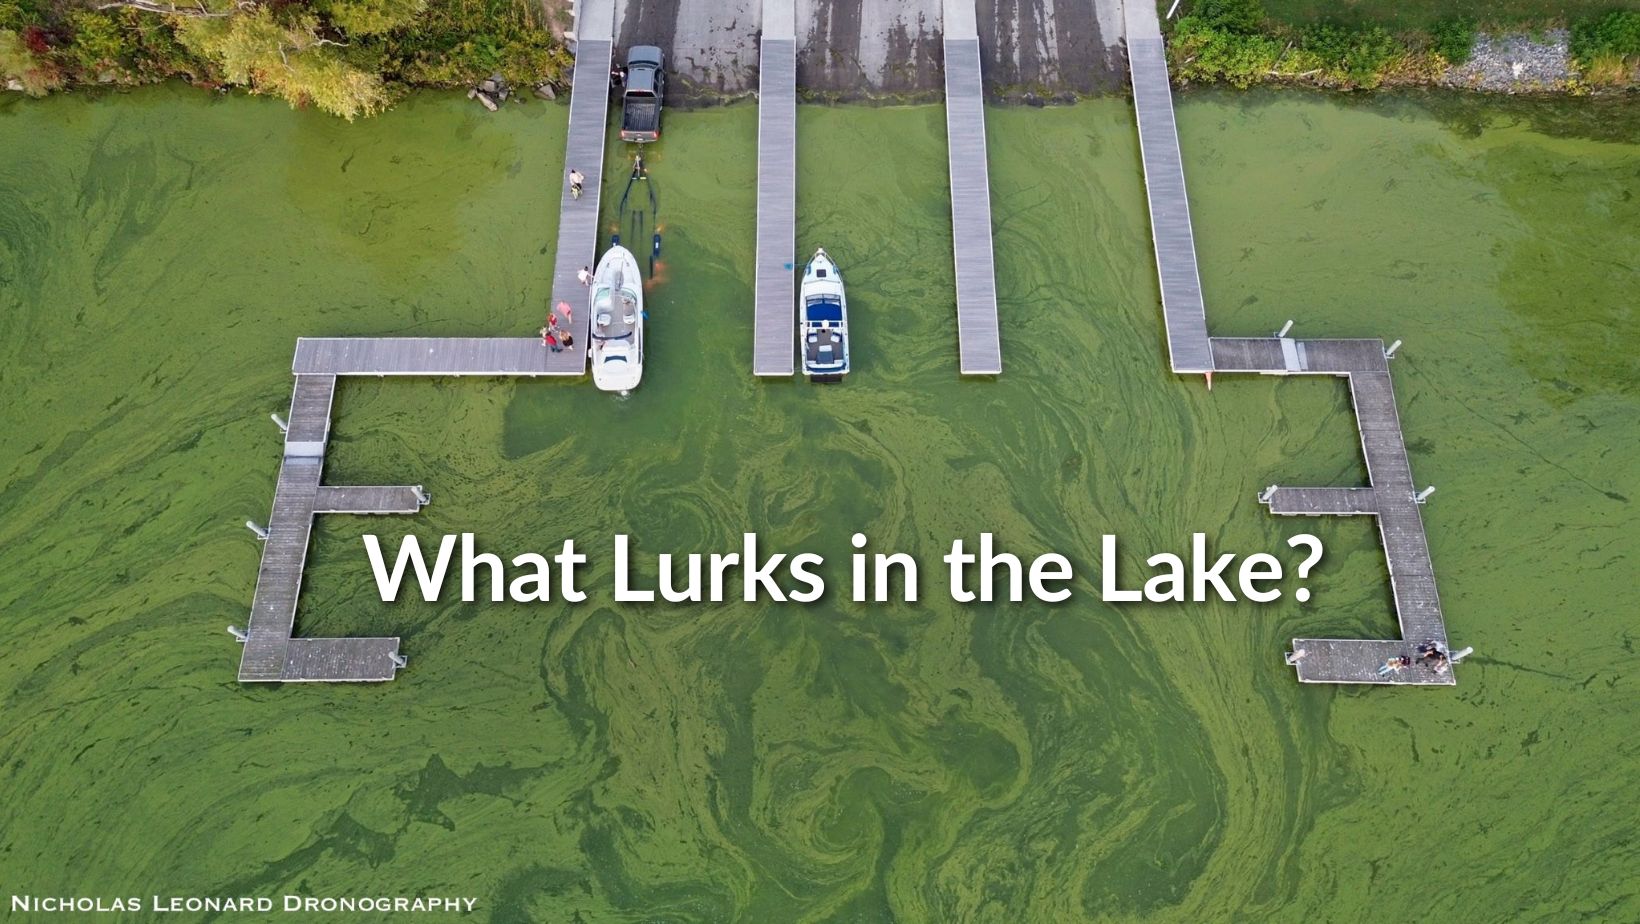
    CSI’s monitoring focus lies at the southern end of Cayuga Lake. Although it has a depth of 435 feet, the “southern shelf”, which extends a few miles out from Stewart Park, is less than 25 feet in depth. This means that pollutants can become more concentrated in the southern shelf than in the rest of the lake. This could lead to problems like oxygen depletion and excessive algae growth. In deeper parts of the lake, the water becomes stratified into three layers: epilimnion, metalimnion, and hypolimnion. These layers are most distinct during the summer months, with water temperatures becoming more similar during the cold winter months.

    The epilimnion is the water that is closest to the surface and is most susceptible to chemical and temperature changes. The water in the epilimnion is warmer in temperature than the rest of the lake and is primarily where fish are found during the summer. If you swim in the lake, you are in the epilimnion.

    The metalimnion is the middle layer that separates the warm, surface water from the cool, deep water. This is where temperature changes most rapidly with depth. The metalimnion is relatively shallow compared to the other two layers.

    The hypolimnion is the deepest, coldest water in the lake. Even in late August, the temperatures in the hypolimnion are just 6-8 degrees Celsius (40-45 degrees Fahrenheit). Despite the cold waters, the hypolimnion is home to a number of aquatic species, including lake trout. Cayuga’s hypolimnion is generally at a depth of 120 feet and below.

    CSI collects most of its samples from the epilimnion, as that is where most changes occur, and grabs a few samples from the hypolimnion as well. If you’re wondering how one goes about getting a water sample from 150 feet down in the lake without scuba diving, check out the video below from the Floating Classroom about the special sampling device known as a Van Dorn Sampler that collects samples at any depth.

    So how does the lake compare to the streams that flow into it? Visit the CSI Database to view and download results from stream or lake monitoring events! The results from the latest Floating Classroom trip can be viewed here: https://communityscience.org/database/events/1074

    [video-item url=”https://www.youtube.com/watch?v=QRL1ICLTt5s” width=”600″ height=”412″][/video-item]

    Share
    No tags.

    NextPrevious

    Connect with Us

    The Community Science Institute
    Langmuir Lab Building/ Box 1044
    95 Brown Rd.
    Ithaca, NY 14850

    (607) 257-6606

    info@communityscience.org

    Support Our Work

    Donate

    Recent Posts

    • Why we volunteer as HAB Harriers

      Please enjoy this article written by one of CSI’s longterm HABs Harriers,

      18 August, 2025
    • Save the Date: “HAB-by Hour” at Cayuga Shoreline

      13 May, 2025
    Copyright 2007-2016 Community Science Institute | Developed by: Abner X. Figueroa
    • About Us
      • Alyssa Johnson
    • Adrianna Hirtler
    • Aleah Young
    • Annual Reports
    • Baseline Testing
    • Bill George
    • Biological Monitoring
    • Biological Monitoring Results
    • Bloom Form
    • Calendar
    • Cayuga Lake 2018 Harmful Algal Blooms Results
    • Cayuga Lake 2019 Harmful Algal Bloom Results
    • Certified Water Testing
      • Non-Potable Water Tests & Fees
      • Potable and Non-Potable Water Tests & Fees
    • Contact Us
    • CSI Data Updates
    • CSI News Archive
    • CSI-Volunteer Database
      • Database Home
      • Pre-Fracking Groundwater Baselines
        • Select and Download Groundwater Baselines
      • Streams and Lakes Data
        • Cayuga Lake Region
        • Select and Download Streams and Lakes Data
        • Seneca Lake Region
        • Upper Susquehanna River Region
    • CSI’s Business Membership Program
    • Dan Pascucci
    • Drinking Water Resources for the General Public
    • Employment Opportunities
    • FAQ – Testers!
    • Frequently Asked Questions
    • Get Involved
    • Glossary
    • Grascen Shidemantle
    • Home
    • Homepage
    • I want to test my water
      • Glossary
    • Journey of Water
      • Young Scientists
    • Kathryn Graham
    • Katia Appel
    • Logout
    • Lost Password
    • Maps
    • Meet Our Board of Directors
    • Meet Our Staff
    • Membership Form
    • Monitoring Partnerships
      • Biological Monitoring
        • BMI Results
      • Harmful Algal Bloom Monitoring on Cayuga Lake
        • Harmful Algal Bloom Datasets
      • Owego Creek Tributaries Monitoring Project with Trout Unlimited
      • Past CSI Monitoring Programs
      • Red Flag Monitoring
        • Red Flag Monitoring Symposium
      • Synoptic Sampling
    • Noah Mark
    • Outreach and Education
      • CSI News and Monthly Updates
      • Learning Materials
      • Press
      • Public Events and Presentations
        • Drinking Water Wednesdays
        • HABs Forum
      • Publications
      • The Water Bulletin Newsletter
    • Rama Hoetzlein
    • Report a HAB
    • Resources
      • Water Quality Resources
      • What’s In Your Watershed? Series
    • Resources
    • Seth Bingham
    • Stephen Penningroth
    • Test Events Page
    • Volunteer With Us!
    • Water Testing Payments
    • Reports
    • Gas Well “Signature Chemicals”
      • Baseline Testing
        • FAQ – Baseline Testing
      • Regional Baseline Initiative
    • Volunteer Partners
      • Funding
    • Donate
      • 2025-2026 Business Membership Partners
    • Blog Medium View
    • database.communityscience.org
    • Message Box
    • Icon
    • Code
    • Qoute
    • Testimonials
    • Team
    • Divider
    • List
    • sliders
    • Font awesome icons
    • Password Protected
    • Gallery
      • Gallery 4 Column
      • Gallery 3 Column
      • Gallery 2 Column
      • Gallery Masnory View
    • Events
      • Events With Filterable
      • Events Right Sidebar
    • Blog
      • Blog Right Sidebar
    • Highlight
    • Dropcap
    • Map
    • Tables
    • Tabs
    • Accordion & Toggle
    • Buttons
    • Images
    • Video
    • Typography
    • Columns
    • Home
    • Services
    • Contact Us
    Community Science Institute
    X