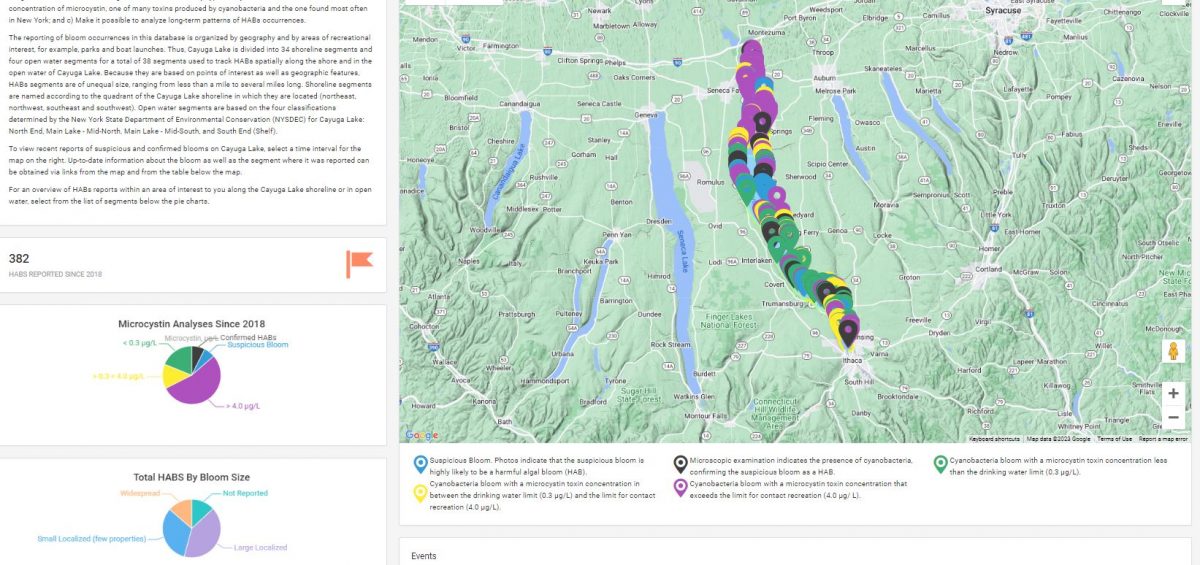
With this new feature on our database, you can:
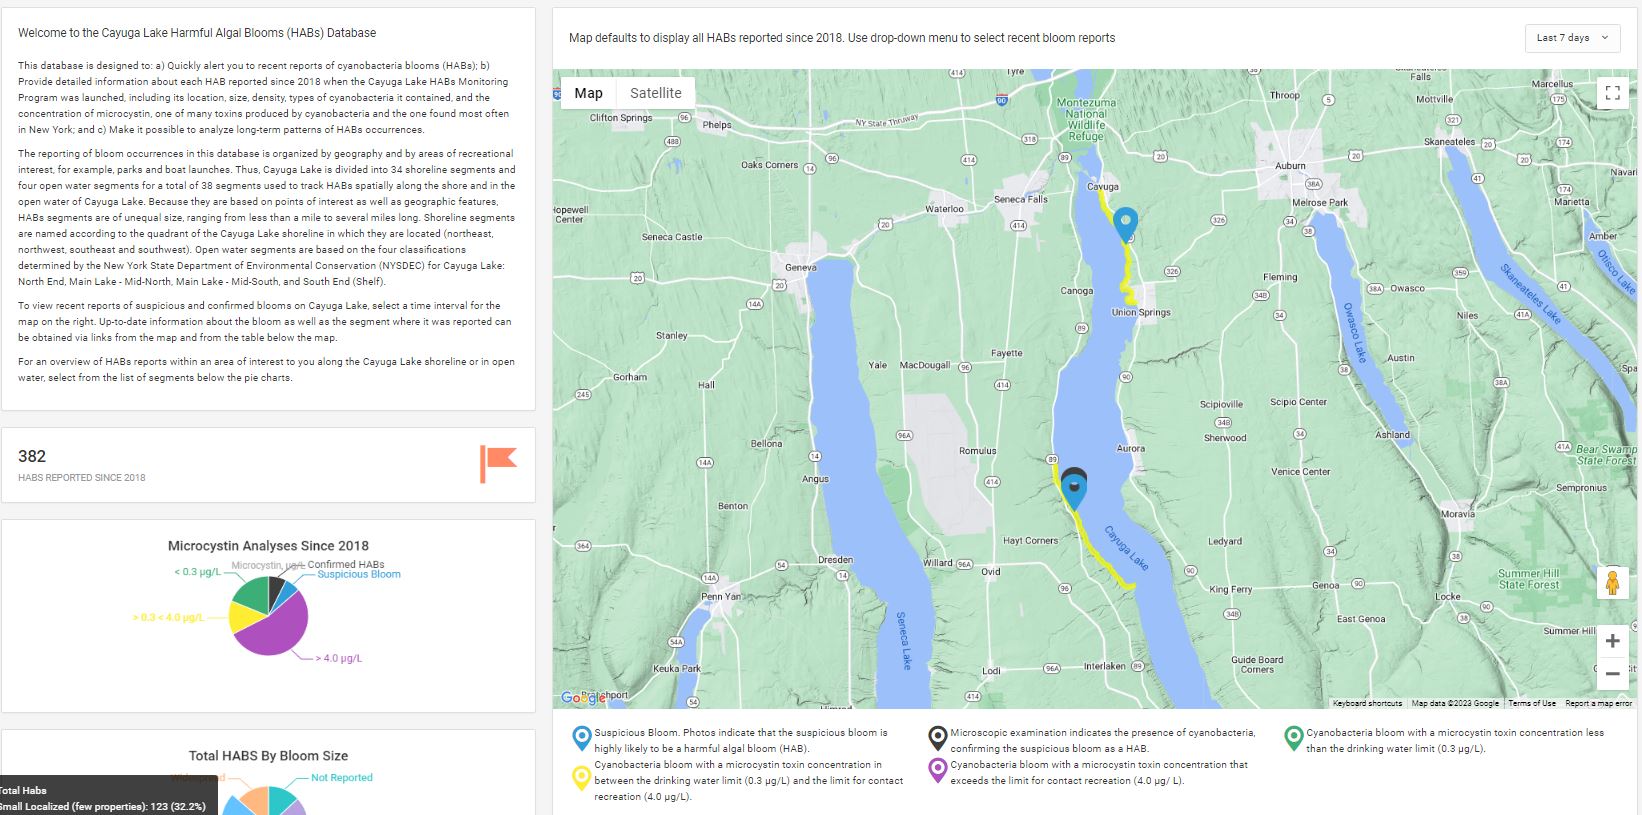
- Monitor active blooms on the lake – just like you could with our HABs reporting page last year.
- Explore data from all previous years of the Cayuga Lake Harmful Algal Bloom Monitoring Program!
- Download HABs data to analyze patterns yourself.
We are so excited to unveil this new portion of our database. The improvements to this page make the valuable data collected by our HABs Harriers (volunteers) more navigable and more visual for the communities around Cayuga Lake. We hope that you will pay this new page a visit to explore the interactive features we have introduced!
Read on for a quick overview of what you can now find on our HABs database. Or, if you need more in-depth guidance, check out our HABs Database Tutorial video on YouTube. With this step-by-step guide, you can follow along with the video on your own computer to learn about the structure and features of the HABs Database!
The HABs Database Landing Page
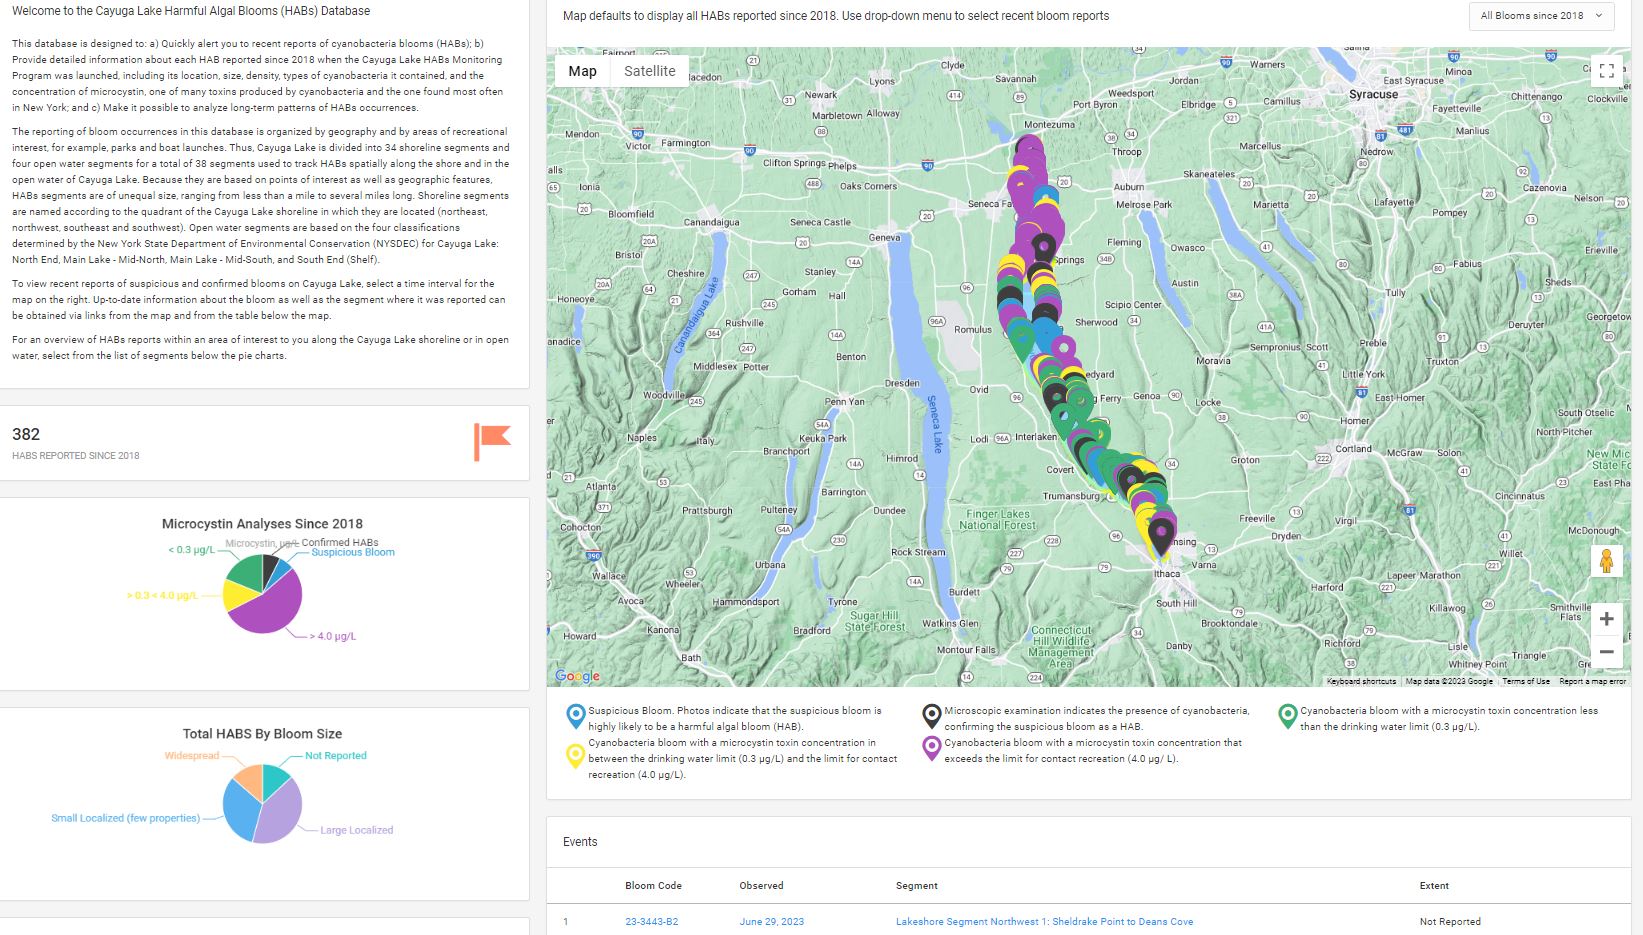
This page shows overall HABs patterns from all years of our HABs monitoring program. If you want to see only recent HABs reports, use the dropdown menu on the top right to change the map’s setting from it’s default “display all HABs since 2018.”
On the landing page, you can see patterns in bloom size and microcystin toxin concentration since we started this program monitoring HABs on Cayuga Lake. Or, you can click on our “Segment Pages” or “Bloom Pages” to dig deeper!
Lakeshore Segment Pages
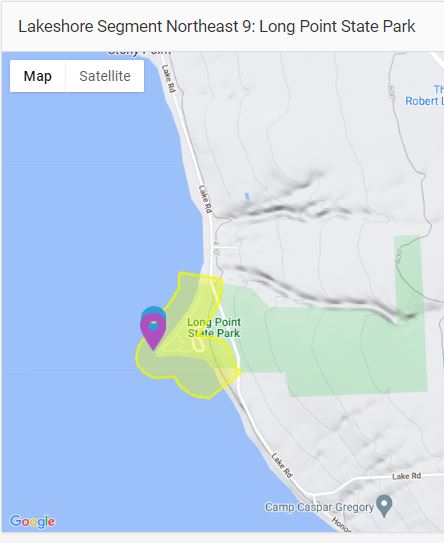
To help you learn about HABs patterns in different parts of the lake, we’ve divided the Cayuga Lake shoreline into “segments” defined by points of interest (like parks and public swimming areas). You can view each segment on their “Segment Pages,” accessible from the Landing Page of the HABs Database. This segment, called “Lakeshore Segment Northeast 9: Long Point State Park,” is currently lacking a HABs Harrier! If you’d like to help us monitor this area for HABs, please send us an email at:
info@communityscience.org
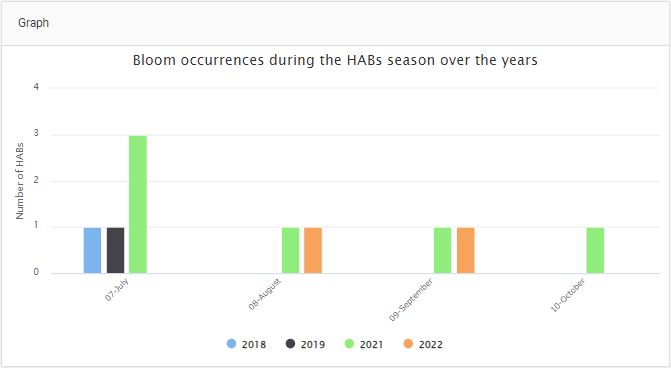
Each Segment Page also contains a pre-populated graph like the one to the right, showing the trends in HABs occurrence over each month of the year and over all years of the Cayuga Lake HABs Monitoring Program. If you click on the color-coded years listed below the graph, you can toggle them off and on!
Harmful Algal Bloom Pages
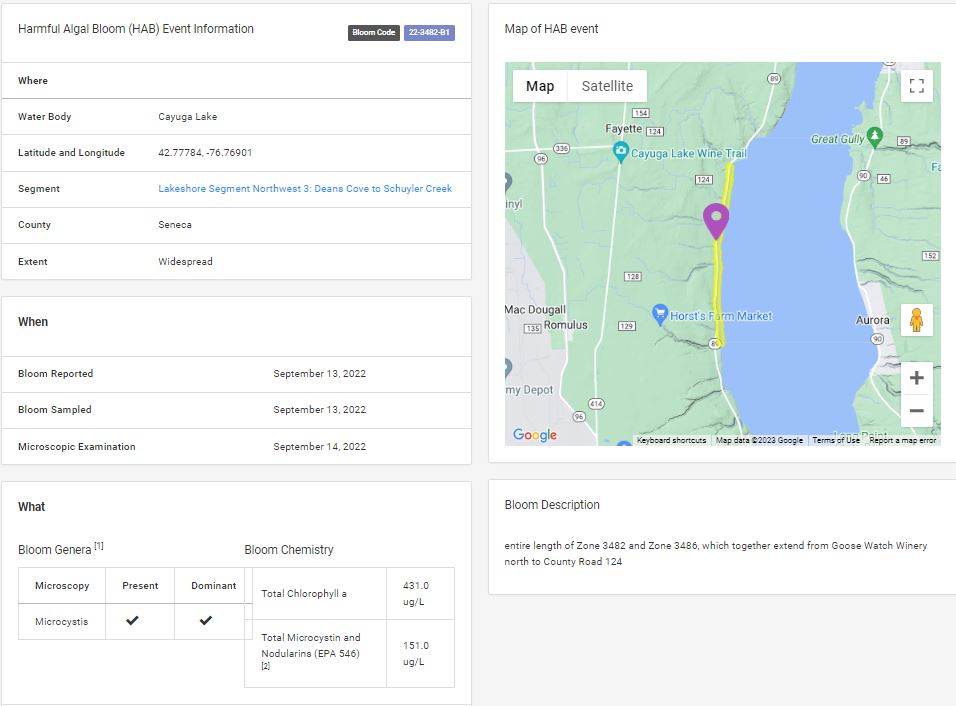
To learn more about any individual bloom, you can visit its page for details about when and where it was observed and what CSI’s laboratory analyses revealed about it! This includes:
- Which genus or genera of cyanobacteria we saw when we looked at the bloom under the microscope,
- The concentration of chlorophyll a (which refers to the bloom’s density),
- The concentration of microcystin toxin (a common liver toxin produced by cyanobacteria).
Do you like the work we’re doing with our Harmful Algal Bloom Monitoring Program? Please consider making a donation to support it!
